WRs Targeting – 2004 to 2015 Deep Sector Analysis! Reference Class Forecasting is the Treatment for the Planning Fallacy.
Quoting
“Few books are “must reads” for intelligence officers. Fewer still are “must reads” that mention Intelligence Community functions or the CIA only once, and then only in passing. Daniel Kahneman has written one of these rare books. Thinking, Fast and Slow represents an elegant summation of a lifetime of research in which Kahneman, Princeton University Professor Emeritus of Psychology and Public Affairs, and his late collaborator, Amos Tversky, changed the way psychologists think about thinking. Kahneman, who won the 2002 Nobel Prize in Economics for his work with Tversky on prospect theory, also highlights the best work of other researchers throughout the book.
Thinking, Fast and Slow introduces no revolutionary new material, but it is a masterpiece because of the way Kahneman weaves existing research together. Expert intelligence officers at CIA, an agency with the “human intelligence” mission at its core, have come through experience and practice to understand and exploit the human cognitive processes of which Kahneman writes. These expert officers will have many moments of recognition in reading this book, which gives an empirical underpinning for much of their hard-won wisdom.”
Folks in the off season you should read this book multiple times! I bought it on Amazon Kindle and use my Evernote app to pin great quotes.
One part of the story is “The Planning Fallacy”
Most projects (Fantasy Football Teams) have overly optimistic forecast as to the outcomes.
Pieces of the Puzzle
1) We must generate baseline stats for the for our positions.
(reference class)
2) We must know the average baseline for our picks.
3) We must be successful and draft based on the best case scenarios but know the average possibilities.
4) We must broad frame the forecasted player’s performance within the total realm of all performance possibilities.
Research Methods
Goal is to develop a general reference class database for my WR drafting, I have been gathering data from the year 2004.
For Each Year’s Data
A) I took the top 50 WRs for each year based on the seasonal PPR points per game.
B) I subdivided those 50 WRs into 10 player sectors labeled Sector 1 to 5.
Sector 1 was the top 10 WRs of that Year.
Sector 2 is Players 11 to 20th player, etc.
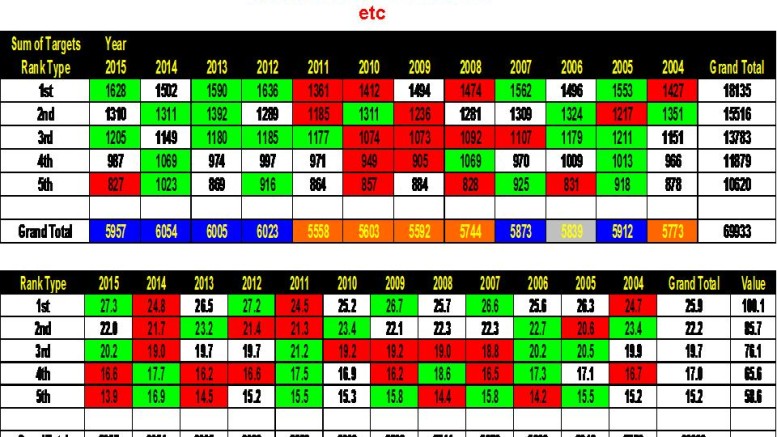
Figure 1A. Top 50 Player of P/G Targets per Year (2004 to 2015)
For example in the year 2015, the top 10 WRs (sector 1) had a seasonal target total of 1628. The average was 162 targets per top 10 WRs in 2015. The 2015 Top 10 WR ranges from 203 to 148.
We expect therefore our TOP WR to have close to 162 Targets
The 12 year average is 1511 targets per the Top 10 WR. 2015 was an above average year for top 10 WR targets. 12 year average was 151 targets per player expected.
When you are drafting for 2016, you should draft WRs expected to be near 150 targets as a WR 1.
In Figure 1A for example in the year 2015 the Top 10 1st Sector WR Players Targets were 1628 which was 27.3% of the 2015 Year’s Total of 5957 targets. Etc.
These dat allow you to follow the Data Flow within Years and Between the Years within the WR Sectors.
Green/Blue is above average and Red/Orange is below average.
We estimated the average value of the drafted WRs in the value column. Sector 1 WRs are worth a 100% on average while the next sector WR 2s are worth on 85.7%, Sector 3 WR3 s are worth 76.1% of the Sector 1 WRs etc.
Green are that years WRs targets above the sector average
Red are below the sector average.
Grand total color coding – Blue is above and orange is below
So over reference class data can be simplified as to the Value of each WR yet draft on average.
If keep records compare your picks to see if you are able to draft players that are the higher ones in each sector.
Do you pick WRs are the lower parts of each sector? This will define your personal strengths.
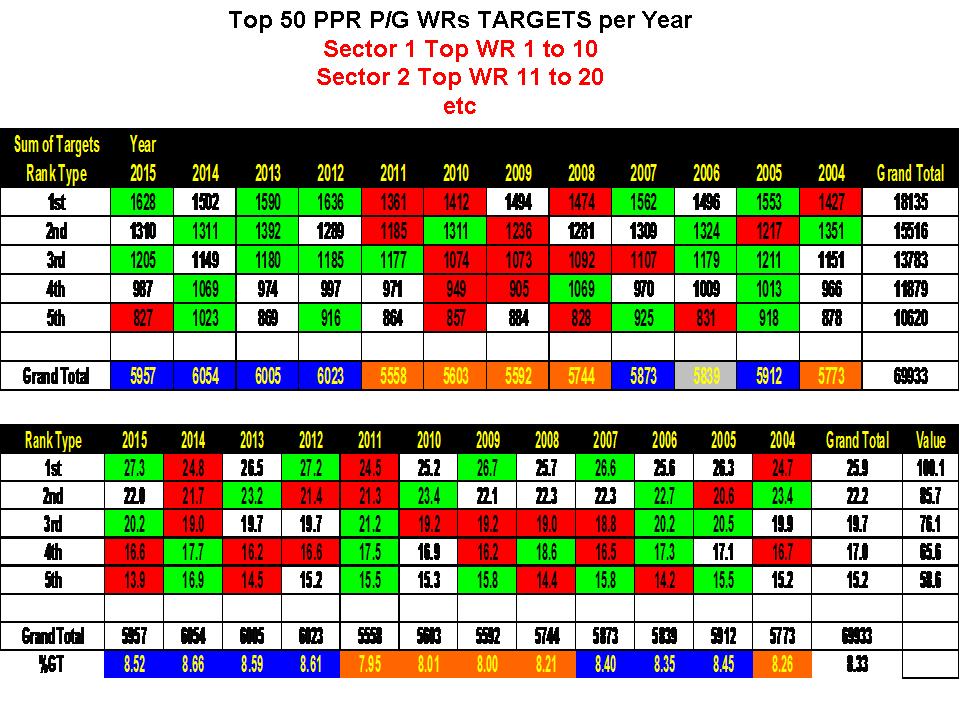
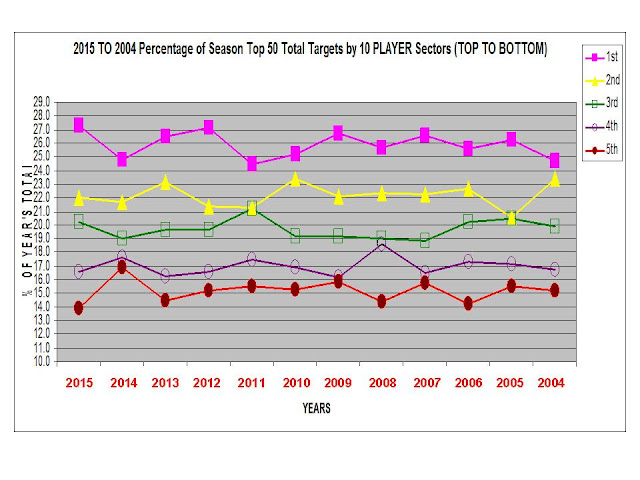
Figure 2 is a Plot of the Tabular Data for your pleasure to “see” the data from Table 1B! The distances between sectors is very distinct. Note the clear Gaps of Sector Targets. That is your reference class.
Conclusions
WR1s (1st) have never dipped into the WR2 Sector (2nd)!
WR2s have meshed with WR3s (2 out of 12 years)!
WR3s are closer to WR2s and can overlap.
WRs 4 (4th) and WRs 5 (5th Sector) seem to be much closer to each other!
- Supports drafting WR1 within the first 10 or so.
- Supports that you can wait if needed while the drafts are within the WR2 and 3 WR drafting levels
- Expect WR2 and 3 Targets to be closer than ADPs would predict on average.
- Expect WR4 and 5 to be on average close together in targets than ADPs would predict on average.
- Figure 2
- I wished to measure the difference within the WR sectors in each year. In 2015 the Sector 1 WR group is assigned a zero. Sector 2 is assigned as a 5.3. That number is calculated using the data from Table 1B. The 5.3 number was from WR1 % of 2015 TGT Total 27.3% – 22.0% ( WR2 % of 2015 TGT Total) = 5.3%.Sector 2 minus the Sector 1 Numbers etc.
I used color coding then to stain the difference numbers from within the years and then compared each years sector difference between the years in each sector! - Figure 3 Tabular Data of the Sector Difference.
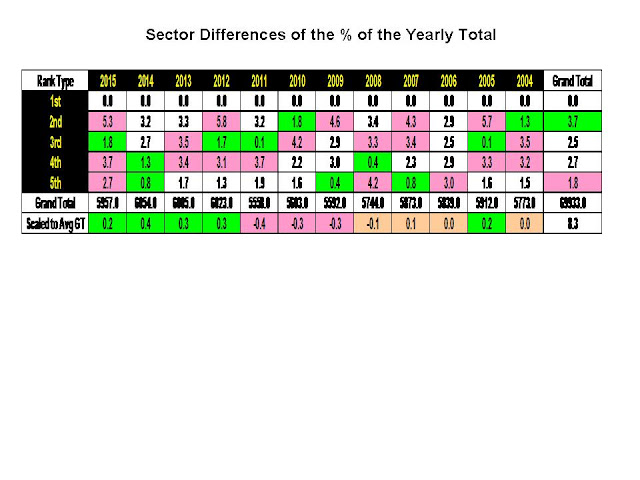
Figure 4 is the Plotted Tabular Data from Table 3
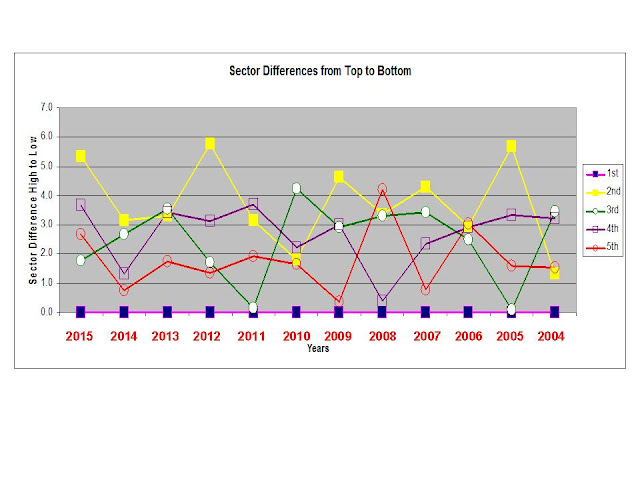
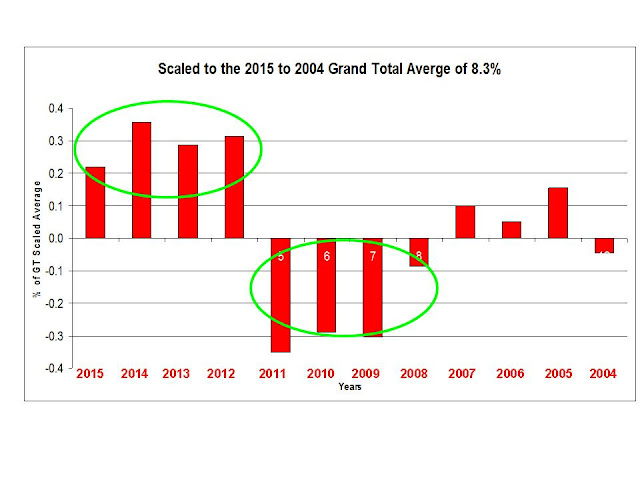
Figure 5 is the plot using the data from Table 3. This data shows the deviation for 2015 to 2004 yearly sector differences as compared to the 12 year grand difference average of 8.3. We can generate a look at each years information in Figure 5. In that Figure 5 the green circles highlight the pattern on Elevated Targets of WR in the last few years as compared to years 2008 to 11.
We now have a clarity to say the WRs have been an elevated targeting environment since 2011! However, pundits are being saying that has never happened. Note the years of 2005 to 07. If you looked at 2011 data and backward you would have been on the radio saying the WRs targets are going down!
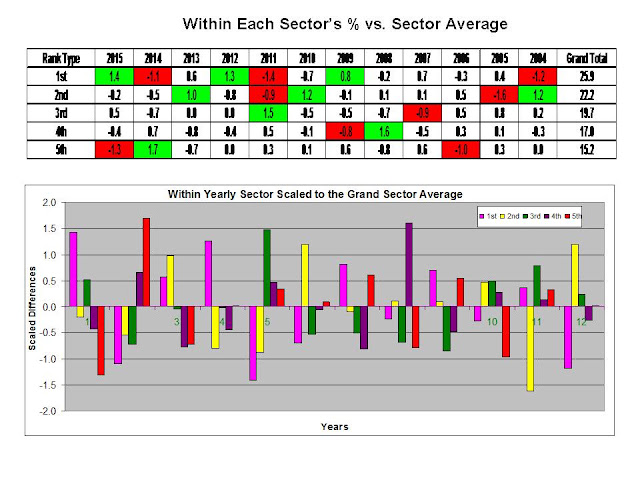
Figures 6 and 7.
I calculated the % of Yearly total vs the the grand Sector average and scaled that number. Green is above average and red is below the average.
So in Sector 1 of 2015 the % from Table 1B was 27.3. The Grand Sector 1 average of percents from 2004 to 15 was 25.9. 27.2-25.9 = 1.4 above the average.
All Sectors were done. Note that WR 1 Sector has had 3 above target years in 2015, 2012 and 2009. Sector 2 WRs have been above average in 2013 and 2010. The bottom 3 segments have been quiet.
I conclude the WR1 and 2 had seen an increase in targets relative to the 12 year average but not as dramatic as has been discussed.
So use this data to think above the reference classes in WR Targets.
Thus you must decide if your WR1 or 2
(Sector 1 and 2 ) is going to be better than the others in that mix.
We have an average and value. This data is here to ground your optimistic planning fallacy.
“Oh my WR2 and WR3 are going to get WR 1 Targets” Hum is that right? That statement is not accurate on the average!
Good Luck
A very special thanks to the Fantasy Football Professor Dr. John Bush!
Make sure you check him out at www.fantasysportsprofessors.com
On Twitter @Prof_Fantasy1
And be sure to pick up his new book on Amazon.
Follow us on Twitter @TheFFNATION
Subscribe on YouTube @FFNATION YouTube Fantasy Football
Connect on Google+ @FFNATION Google+ Fantasy Football
Other Reads:
NFL Power Rankings
Winning Fantasy Football Combinations
Top 50 Wide Receivers 2016
Top 40 Running Backs 2016
Top 30 Tight Ends 2016
Top 35 Quarterbacks 2016
Daily Fantasy Sports Premium Strategy, Tips and Lineups
Miami Dolphins Fantasy Combinations
NFL Comeback Player of the Year
Top 55 – Big Board Player Rankings
Best NFL Pass Rushers 2016
Fantasy Football Sleepers
NFL News
NFL Fantasy
NFL FOX Fantasy


Be the first to comment on "Wide Receiver Targeting – 2004 to 2015 Deep Sector Analysis!"