Fantasy Football Draft Strategy with Dr. John Bush
PPR Based Positional mapping Current Version and Draft Pick Auto-drafting Results Deep Level Analysis!
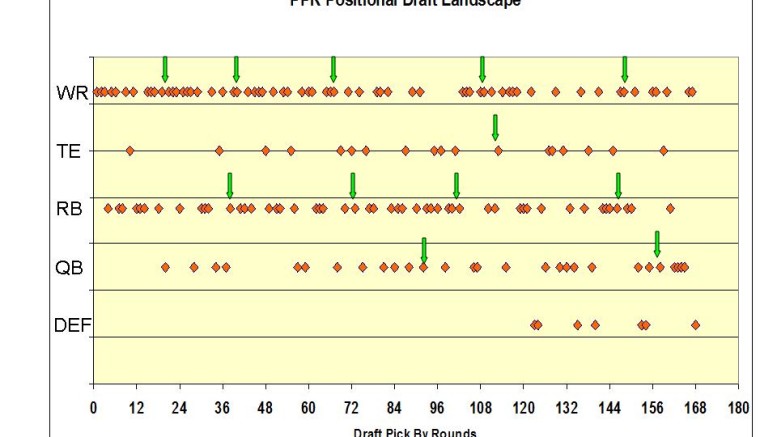
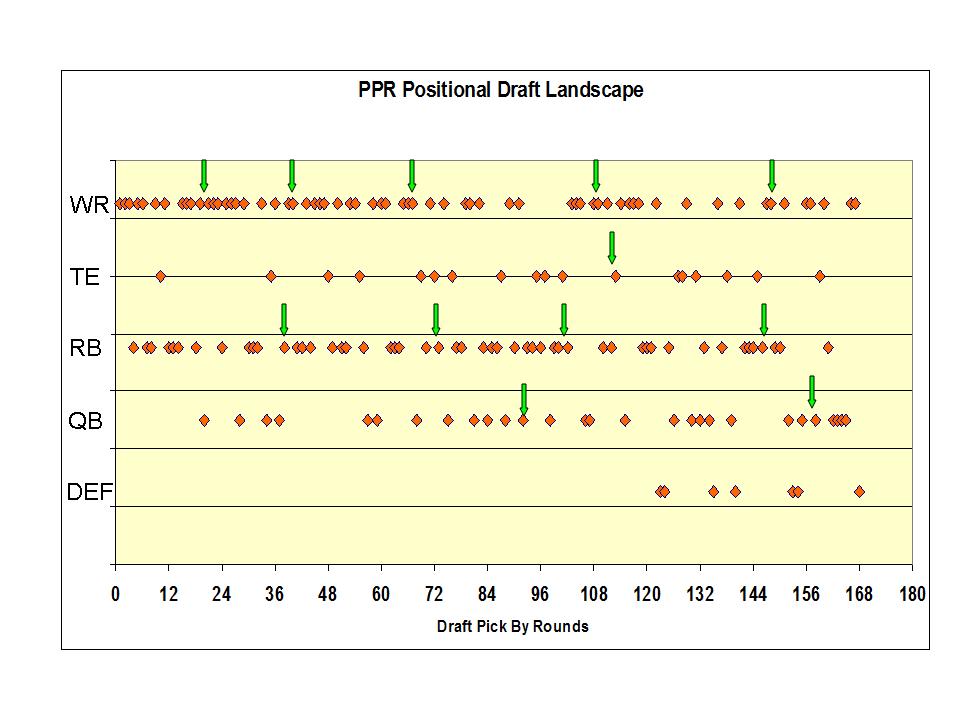
Drafting Landscape. Green Arrows note end of a 12 player group! For example the WR1s are ending between the 1 and 2 rounds (mid). The Run on WRs continues in PPR. The first RB1s are gone by pick 36.
Take home – see end of article.
As far I know, I am the FIRST to report this concept
WR drafted earlier have shifted the risk levels up within the WRs as a group as well as shifted the risk levels to other positions as well as in the TEs and QBs as well.
So players think they are avoiding risk are merely shifting it to other places!
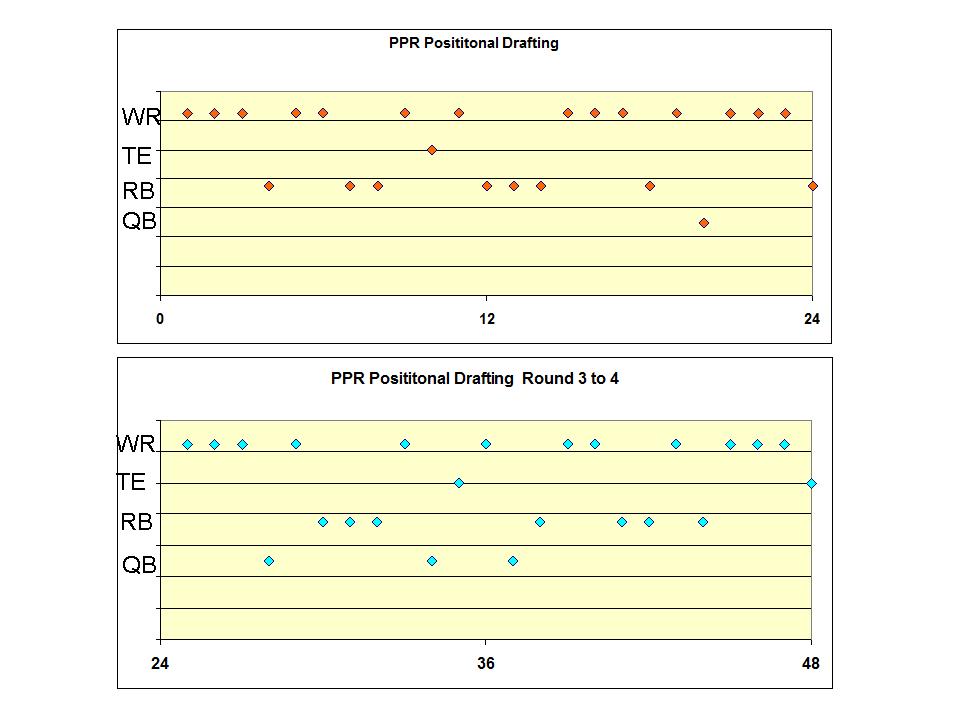
Magnified view of rounds 1 to 4
Numbers of each position drafted in PPR if using autodraft as compared to draft pick. Green denote highest amounts of that position vs all 12 draft picks.
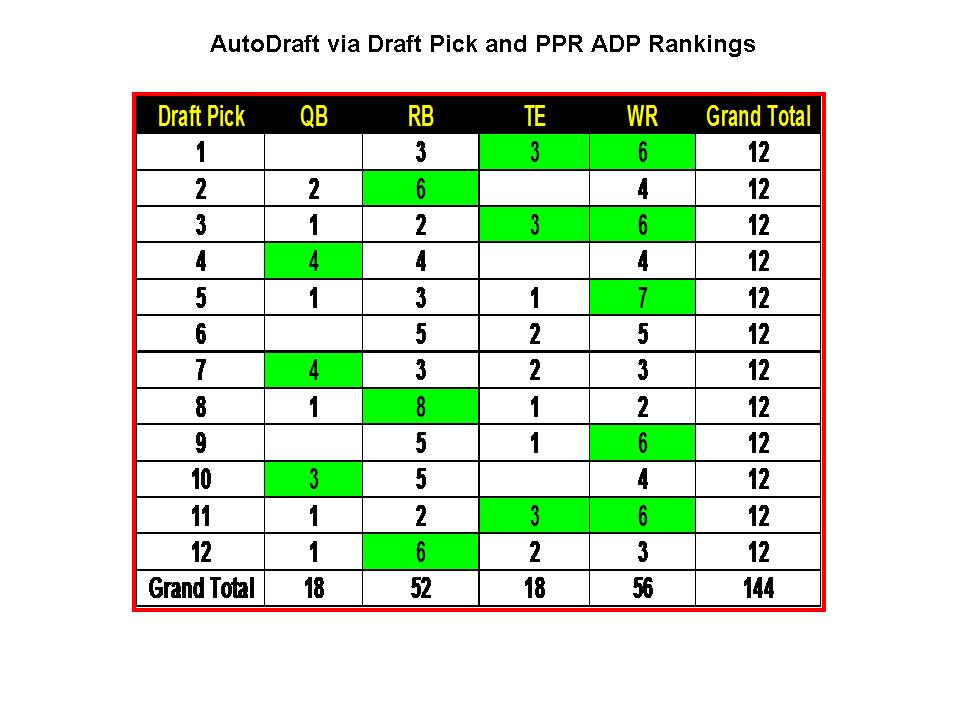
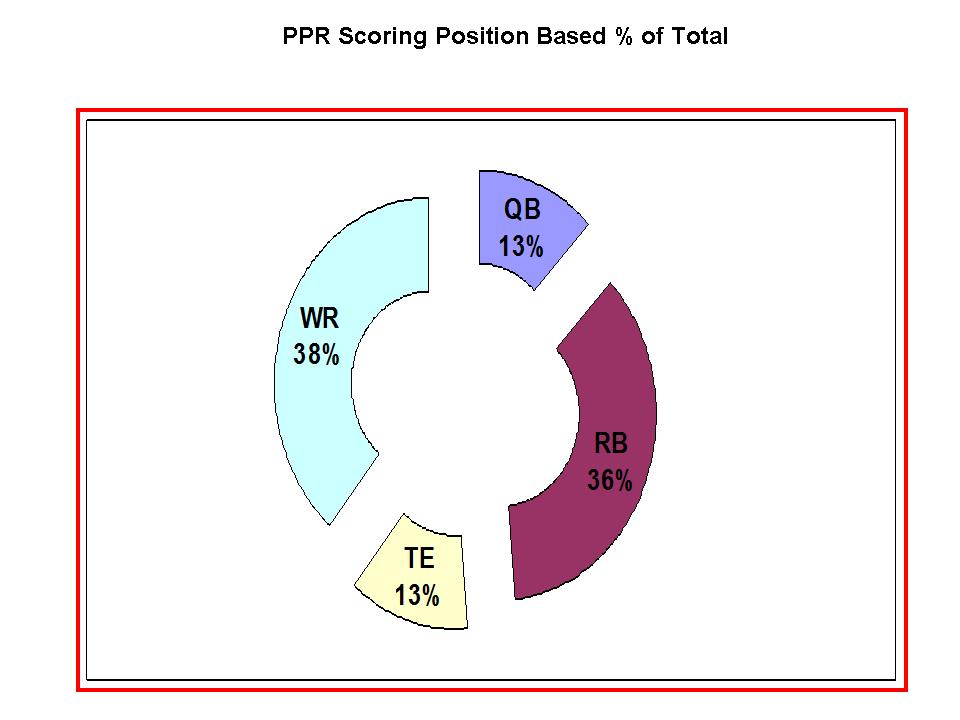
This is an exploding doughnut illustrating the proportion of each position autodrafted. RB and WR are clearly the winners of most drafted. Note that RBs “catch up” with WRs. So focus on when the “catch up” happens. It looks like in the orignal figure that starts at pick 72 ish! So plan your draft accordingly.
Questions –
Which Later WRs should be grabbed after round 6 while the RBs are getting extra attention?
What RBs must be grabbed before the RB run occurs?
Be contrarian!
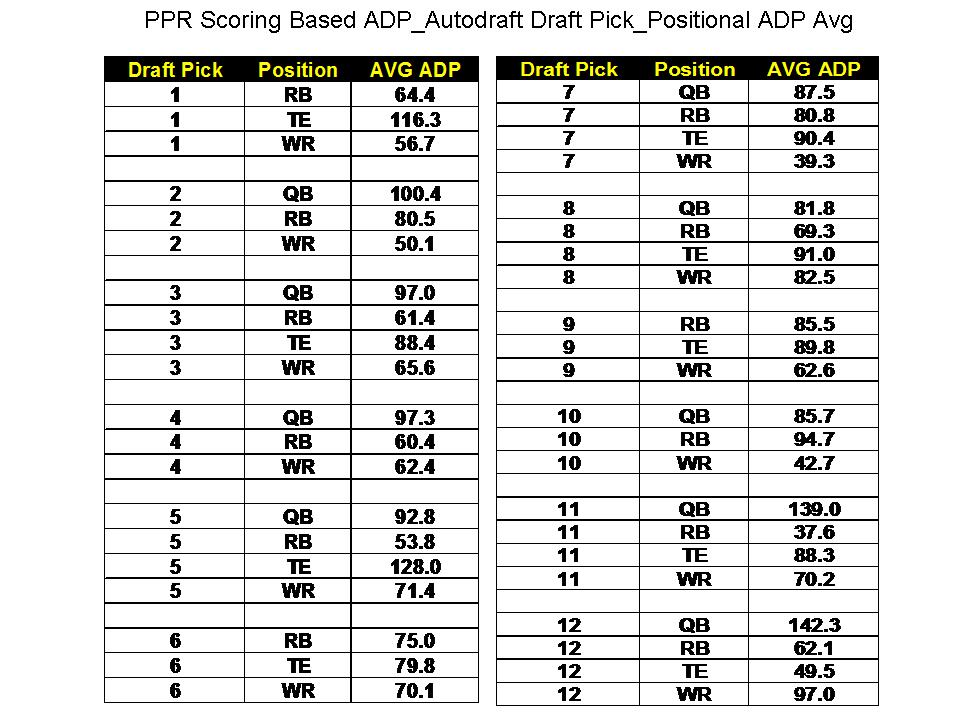
Tabular Form of each position drafted by draft pick and the Avg ADP number association. Where is the best Draft Pick for RBs, WRs, and TEs?
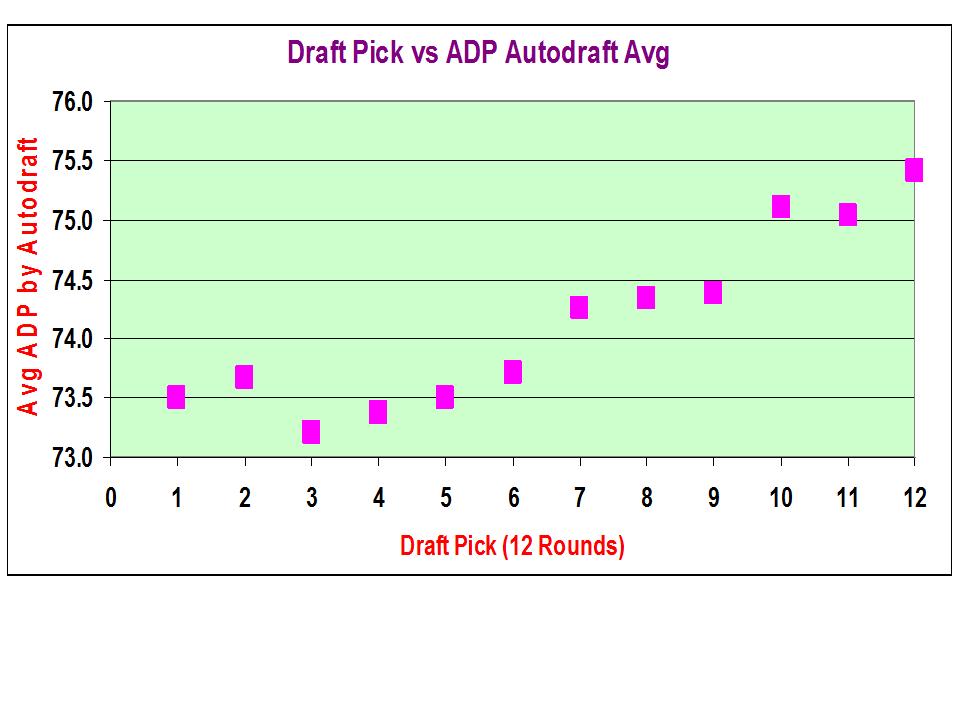
This graph maps the Avg of all the Draft Picks players at each draft picks. Pick 3 is the winner while pick 12 this year averages the worst. If you are pick 12 you need to be aware and shake up your picks the try to beat the average!
These Tables Divide the Positions and compare directly each Draft Pick with its Avg of the player Avgs of their ADP. Green arrow denote the best draft picks for that position!
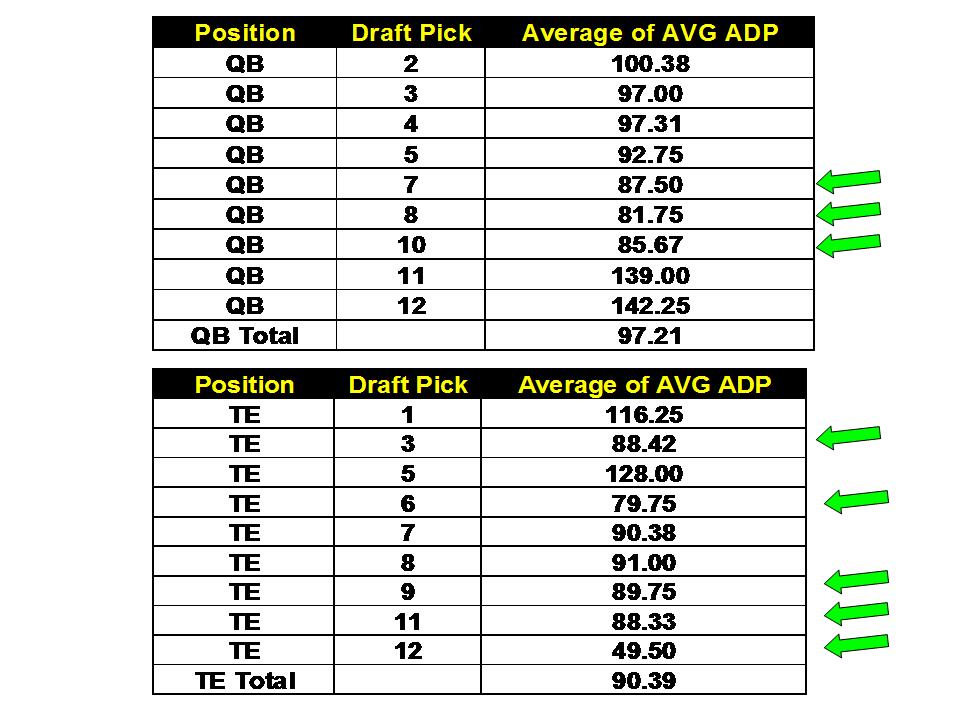
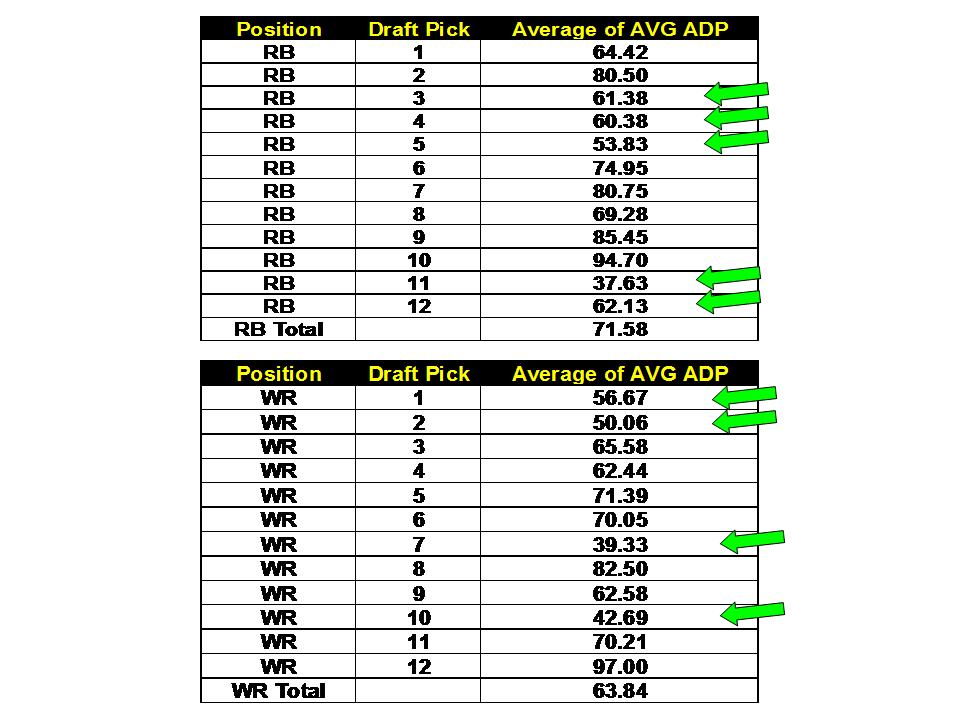
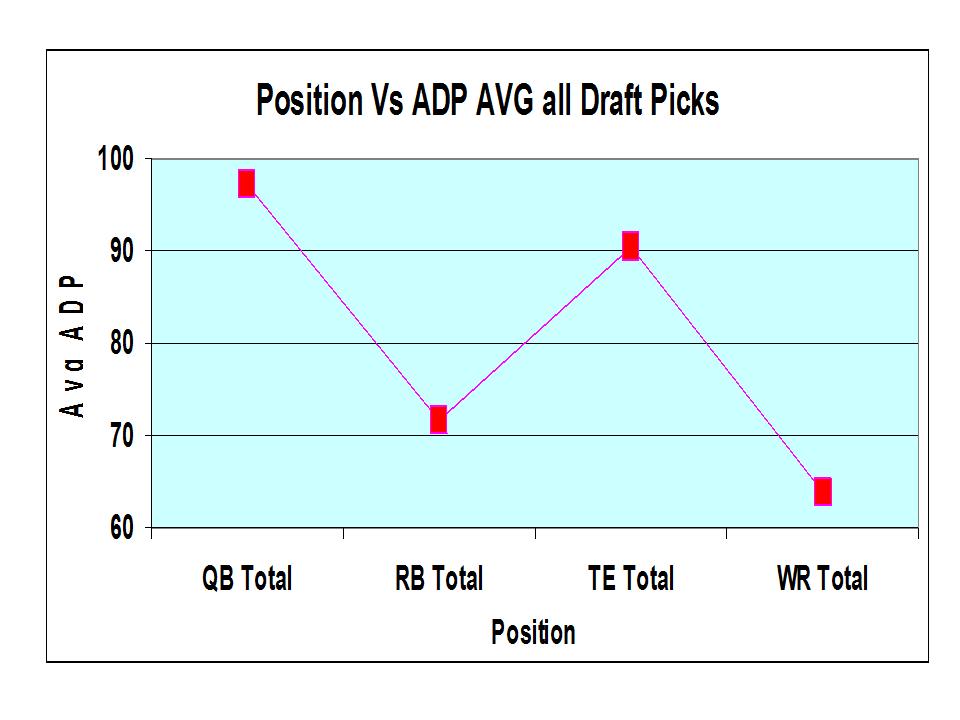
I graphed the Avg of each position’s all draft picks. I analyze these data and my thoughts are that that the WRs as a group because being drafted early will have the lowest ADP followed by Rb, TE and lastly by QB. QBs are being drafted late. These data are different that I saw in 2015!
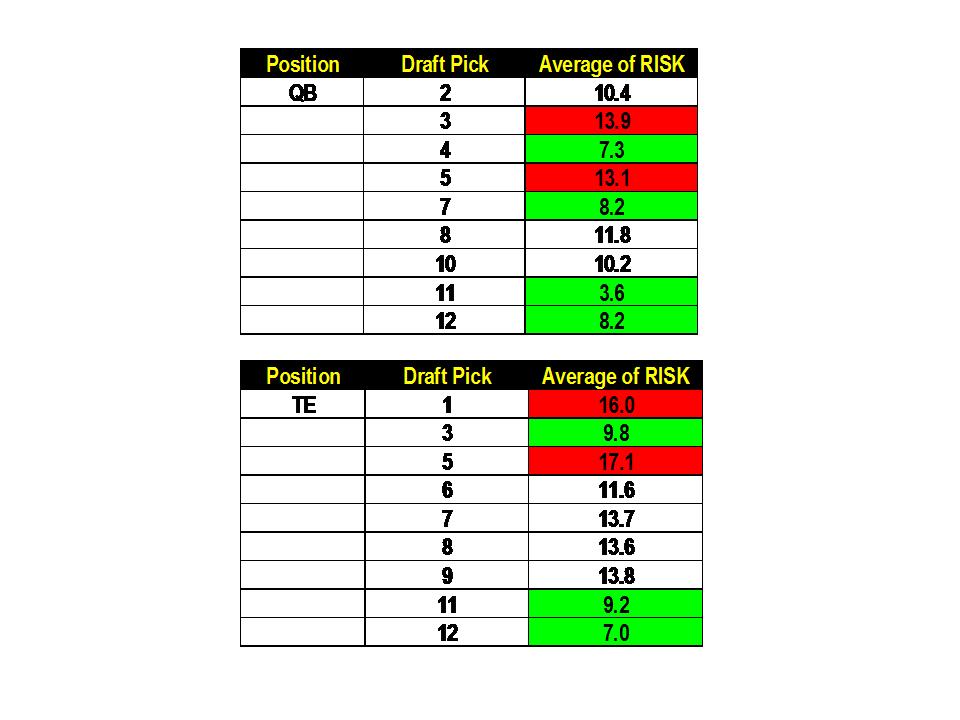
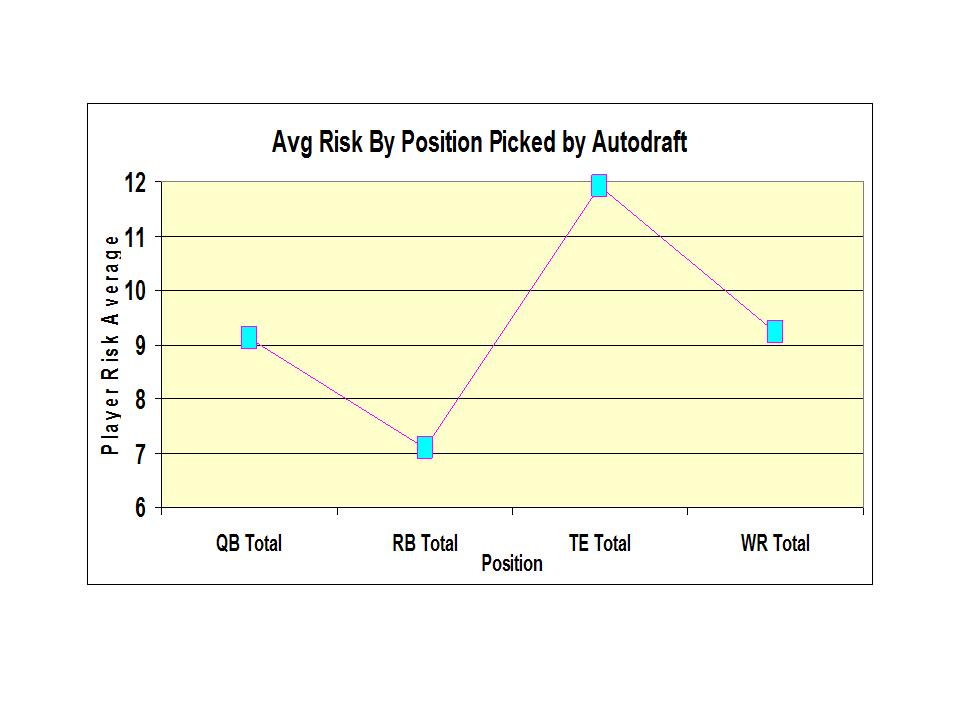
I calculated my special Risk numbers and avg them for each group of player in each position and draft pick! Green denote the lower risk player group while the red denoted the higher risk groups.
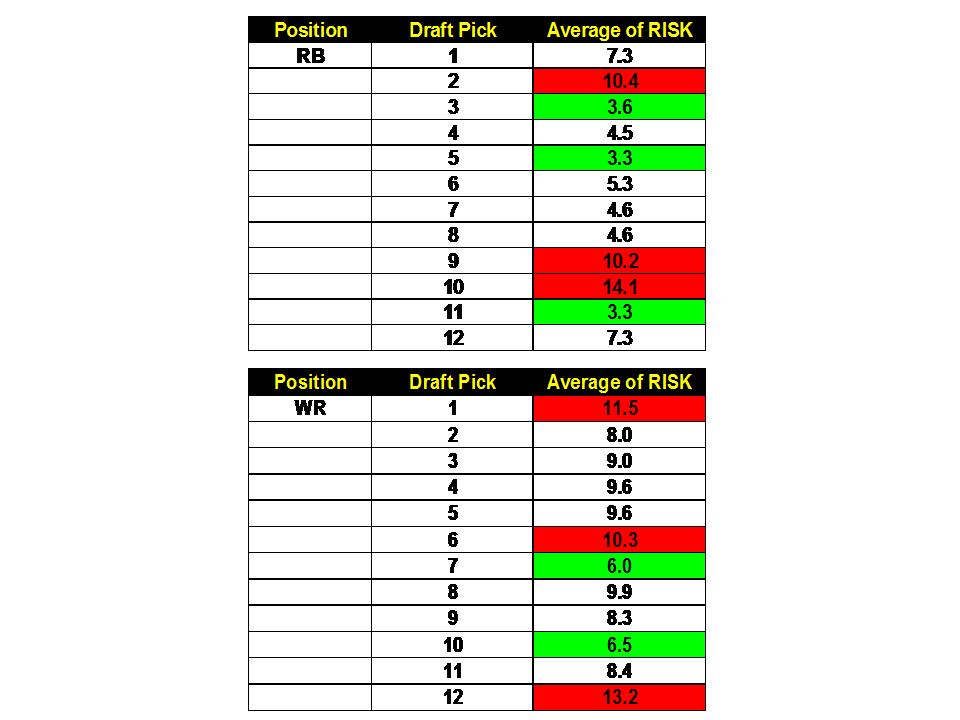
I graphed the average of the Avgs of player Risk by entire group! Note given the early drafts of WRs this year, that is driving them to have a high risk relative to where they are being drafted! RBs because of being drafted later have as a group the lowest risk average I have seen in several years!
Note the TE group has the extreme average risk relative to draft positions. TEs have always been high but the move to early
WR drafted earlier have shifted the risk level up and well as in the QBs as well.
So players think they are avoiding risk are merely shifting it to other places!
Fantasy Football Draft Strategy guest post courtesy of Dr. John Bush. Check him out @ www.fantasysportsprofessors.com
Follow us on Twitter @TheFFNATION , @MoonManFFNATION
Subscribe on YouTube @FFNATION YouTube Fantasy Football
Connect on Google+ @FFNATION Google+ Fantasy Football
Other Reads:
NFL Power Rankings
Winning Fantasy Football Combinations
Top 50 Wide Receivers 2016
Top 40 Running Backs 2016
Top 30 Tight Ends 2016
Top 35 Quarterbacks 2016
Daily Fantasy Sports Premium Strategy, Tips and Lineups
Miami Dolphins Fantasy Combinations
NFL Comeback Player of the Year
Top 55 – Big Board Player Rankings
Best NFL Pass Rushers 2016
Fantasy Football Sleepers
NFL News
NFL Fantasy
NFL FOX Fantasy

Be the first to comment on "Fantasy Football Draft Strategy – Draft Data"